
Bitcoin Short-term Price Analysis: June 14
16 Jun 2020
Although bullish on a longer time frame, bitcoin has shown bearishness on the lower time frame on multiple occasions. As it has been hovering in the $9,000 range for more than a month, the price looks increasingly bearish.
With the market cap of $173 billion, the coin has seen a 1% surge in the last 24 hours. Catching a break from its nasty fall of $800 [$9,800 to $9,000], there are signs of a continuation of this drop.
Bitcoin’s one-hour chart
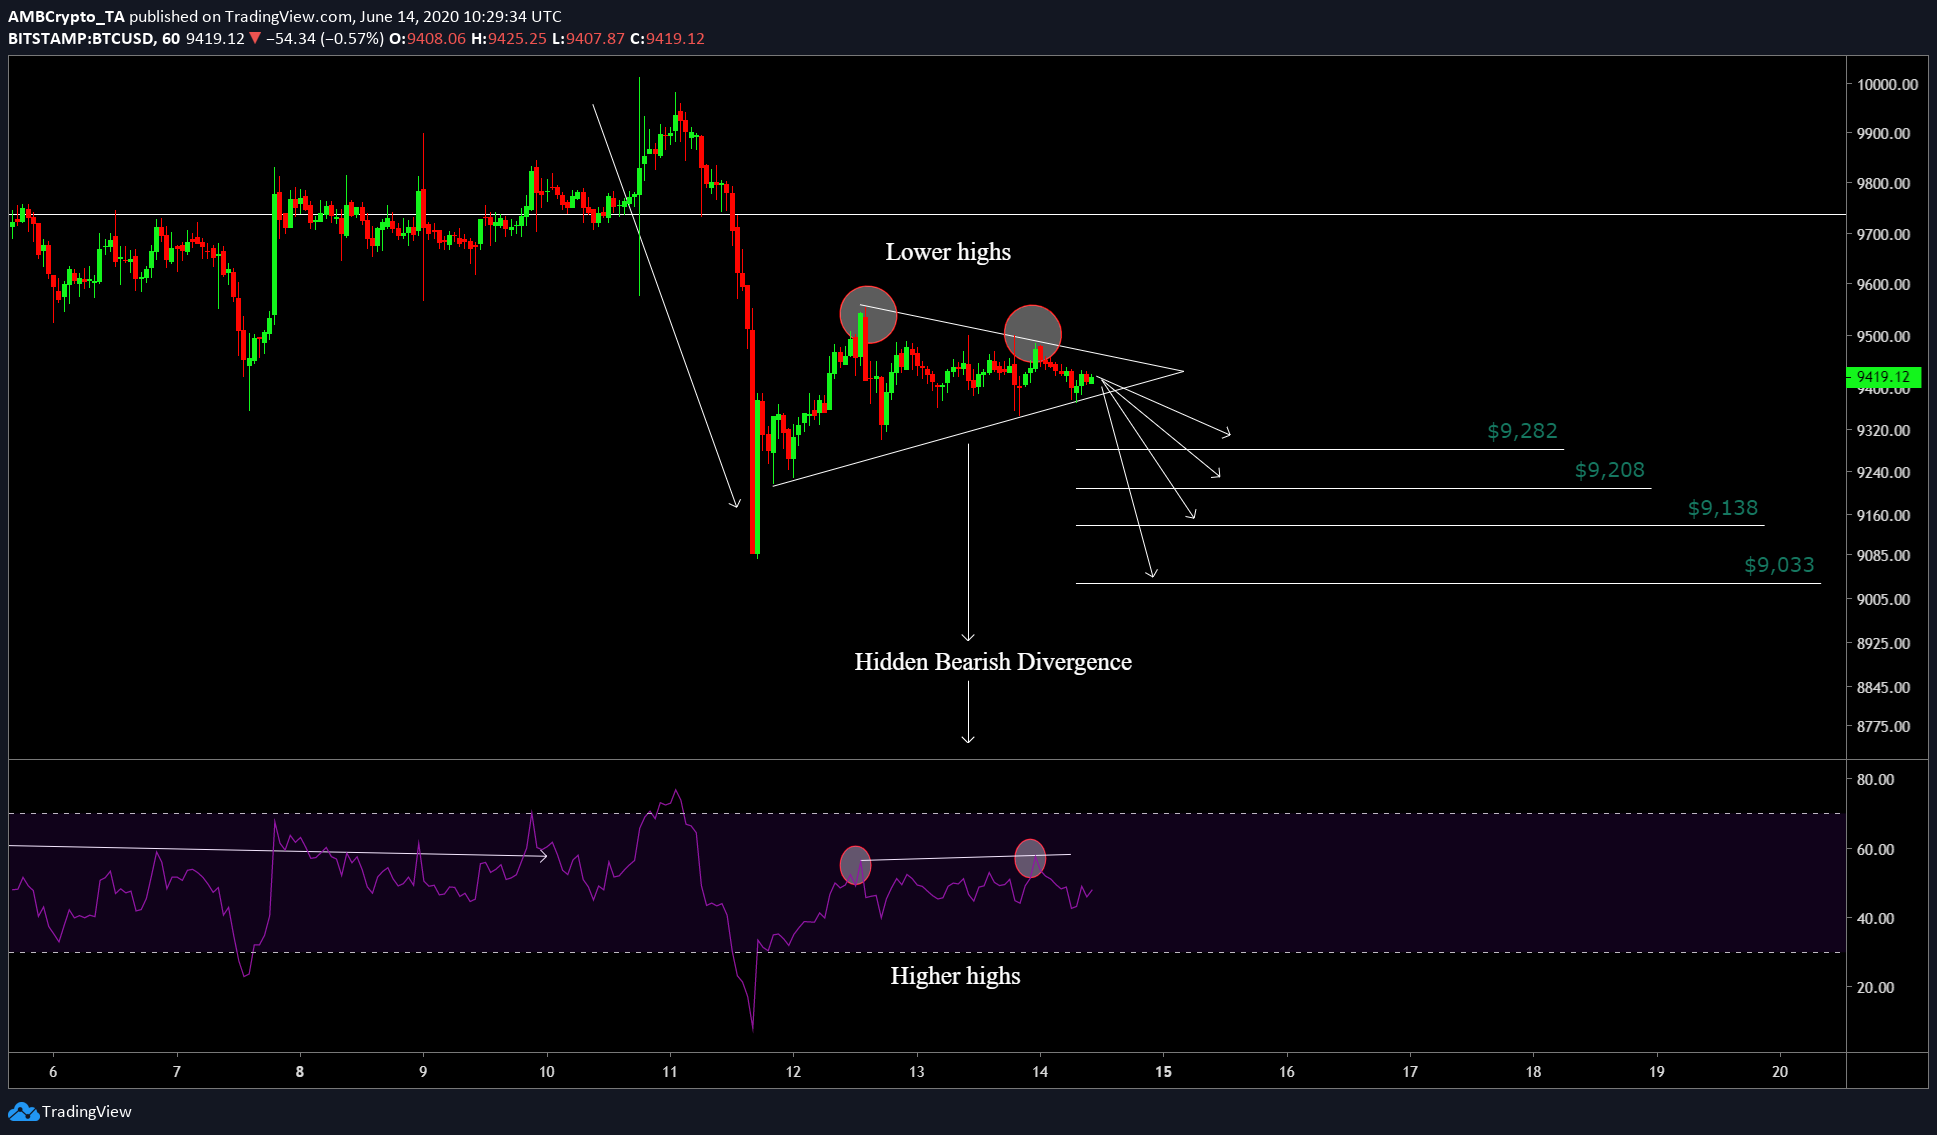
BTCUSD TradingView
From the chart, it can be seen that the price is forming a pennant, more precisely, a bearish pennant, which also happens to be a continuation pattern. Thus, another drop seems inevitable. Making things worse is its correlation with the stock market; as the Dow Jones suffered a drop a few days ago, so did bitcoin.
Additionally, the formation of a hidden divergence between the price and RSI has also favored the bearish scenario. A hidden bearish divergence is when the price forms a lower high and RSI forms a higher high.
In combination, the bearish pennant pattern formation and bearish divergence make a bearish case for Bitcoin, in the short term. Hence, the likely targets include, $9,282, $9,208, $9,138, and $9,033.
Conclusion
The short term nature of Bitcoin is, no doubt, bearish, however, what can be debated is the extent of the drop. As mentioned above, the price in the next 24-48 hours could drop anywhere from $9,200 to $9,000. On the daily time frame, the coin looks bearish as well and a drop in the lower time frame [of one-hour] could be the initial momentum required for the price to start its breakout from the parallel channel that has been forming for over 3 months [since the Black Thursday drop].
Did you like this article?
Your feedback is important to us!
Source From : Ambcrypto


© CoinJoker 2019 | All Rights Reserved.